This is not a normal post for this blog.
I usually write here about programming, about Drupal, and lately a lot about AI and how it's changing the day-to-day as a freelancer. Today is different. Today it's about economics, demographics, and how Spain is doing. Spain is where I was born, even though I don't live there right now. Let me make this clear: I'm not an economist, nor do I want to be. I'm a programmer who saw something on Twitter this week that's worth saving before it disappears.
The story, in short, is that they've been tearing each other apart on Twitter. There's an economic commentator called Jon González who, for years, has been publishing charts about the state of Spain: pensions, salaries, housing, tax burden, everything. He did it well. He always cited the official source and didn't make anything up. A few days ago, a handful of journalists, or people who call themselves journalists or economists (I'm not sure to what extent they really are, given some of the nonsense they come out with), organized a smear campaign against him for working at BBVA bank. In the end, Jon has shut down his Twitter account. We don't know if it was due to exhaustion, internal pressure from BBVA, or some other reason.
The good news is that, before closing Twitter, some months ago he opened a Notion page with all his charts so people could check them:
https://www.notion.so/217f0c22a6908003a754f3050dff68c8?v=217f0c22a690800cadee000cccb18078
I have no idea how long that Notion page will stay public. Just in case, I'm leaving here the links and screenshots of the ones that struck me the most, with a quick comment on each. If you're Spanish, you'll probably relate to a lot of this, unfortunately.
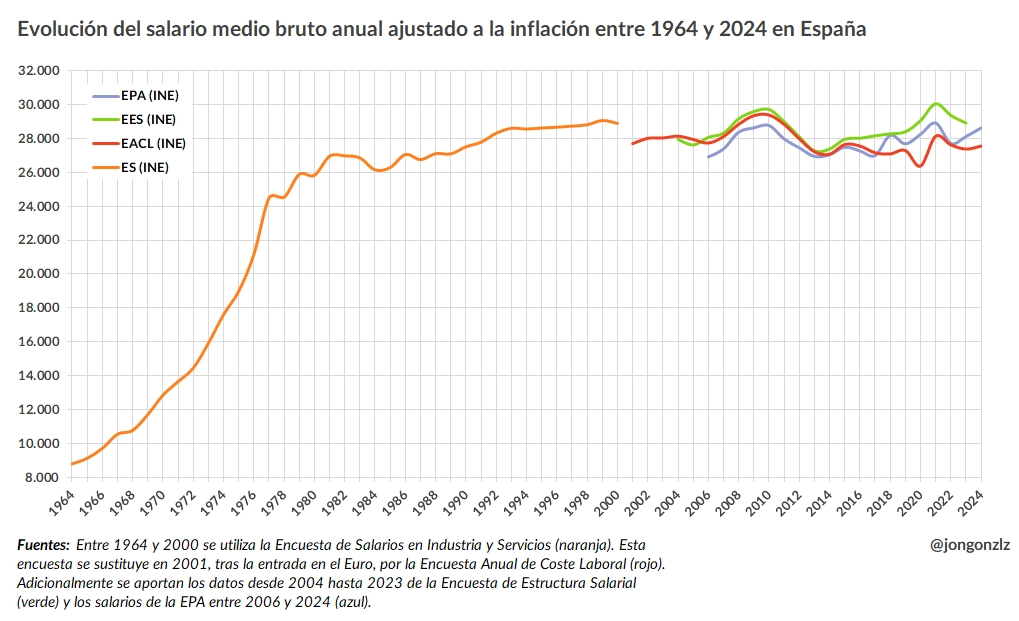
Spanish salaries have been flat for decades. 1964-2024
https://www.notion.so/Hist-rico-salarios-Espa-a-1964-2024-2cef0c22a6908022add2f57524ce6572
The first chart is Spain's average gross salary adjusted for inflation, from 1964 to 2024. Sixty years. And the conclusion that jumps out is pretty depressing. Adjusted for inflation, the average wage has barely moved in recent decades. There are ups and downs, of course, but the overall trend is a flatline.
In plain English, this means Spain has been stagnant for a very long time in terms of real purchasing power. Your parents earned little. You earn roughly the same if you look at real euros. And very likely your kids will too, if everything keeps going the way it's going. This isn't the fault of any specific government or party. It's structural.
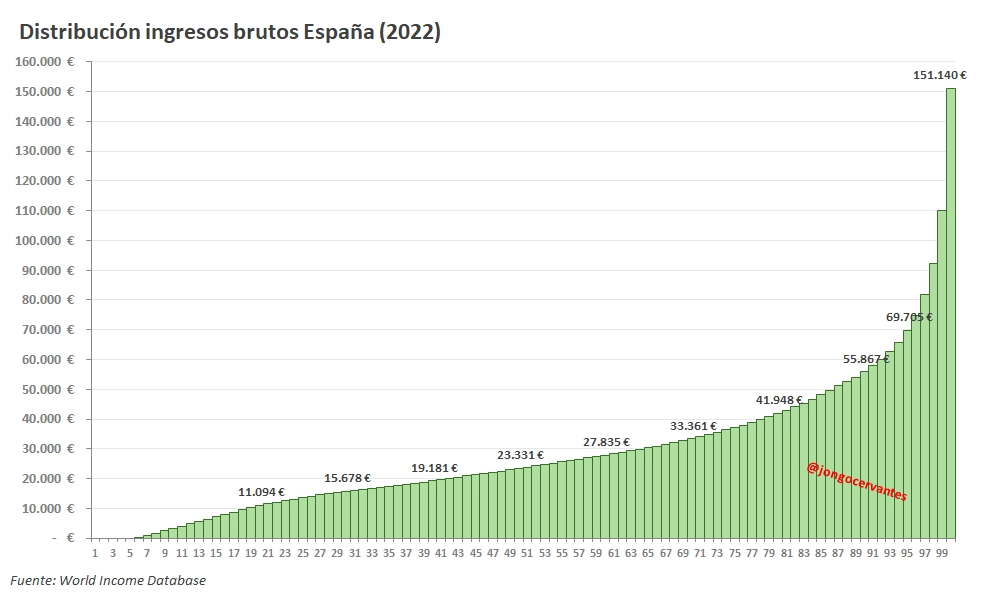
Earning €30,000 and being one of the "rich"
https://www.notion.so/Distribuci-n-ingresos-brutos-Espa-a-2022-218f0c22a690809aad1efb063633d002
This chart is even more brutal. With 2022 data, if you earn more than €30,000 gross per year in Spain, you're in the top 35% of earners. The median is €23,500 gross. So, half of the country earns less than that.
I'm going to bring this to our sector, which is what I know. Any programmer with a couple of years of experience should easily be earning over €30,000 gross per year. I, given the path I took, earn quite a bit more than that. And in no expensive European city, and certainly in no expensive Spanish city, would someone making €30,000 gross consider themselves rich. In Madrid or Barcelona, that figure lets you live decently and not much else. Buying a home? Forget it.
And yet, the data says what it says: if you earn that, you're already above two-thirds of the country. If you earn more than €50,000 gross, you're part of the statistical VIP club. The conclusion you have to reach, like it or not, is that the general level of salaries in Spain is very low. It's not that you earn a lot. It's that most people earn very little.
We'll see what happens to the programming sector now that AI is here to change everything, but for the time being we're still well above the Spanish average. That's a privilege worth being aware of and reminding ourselves of from time to time.
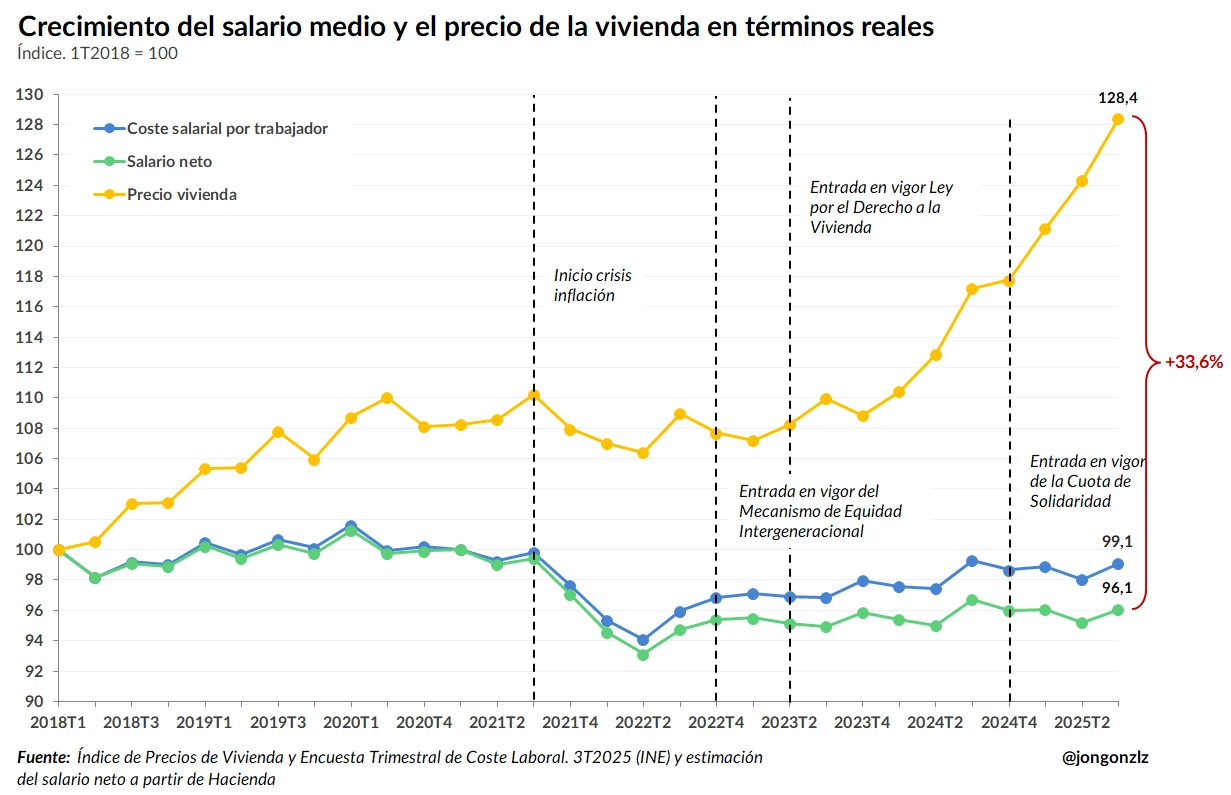
Housing in another galaxy
https://www.notion.so/Crecimiento-del-Salario-medio-y-vivienda-2cef0c22a6908097a7f9e772eb8415a7
If the previous chart made you feel bad, brace yourself. This one (inflation-adjusted) compares the evolution of net salary with that of housing prices. Both start at 100 in 2018. In 2025:
- Net salary is at 96. Yes, it's gone down.
- Housing prices are at 128.
So, in seven years, someone earning the same as in 2018 finds themselves facing a home that costs 30% more on average (much more in big cities). And that's why young people in Spain don't buy houses. They can't save enough to even try.
Honestly, I have several friends my age still living with their parents. And their only options are sharing a flat or staying at their parents' place.
Pensions that do go up (salaries don't)
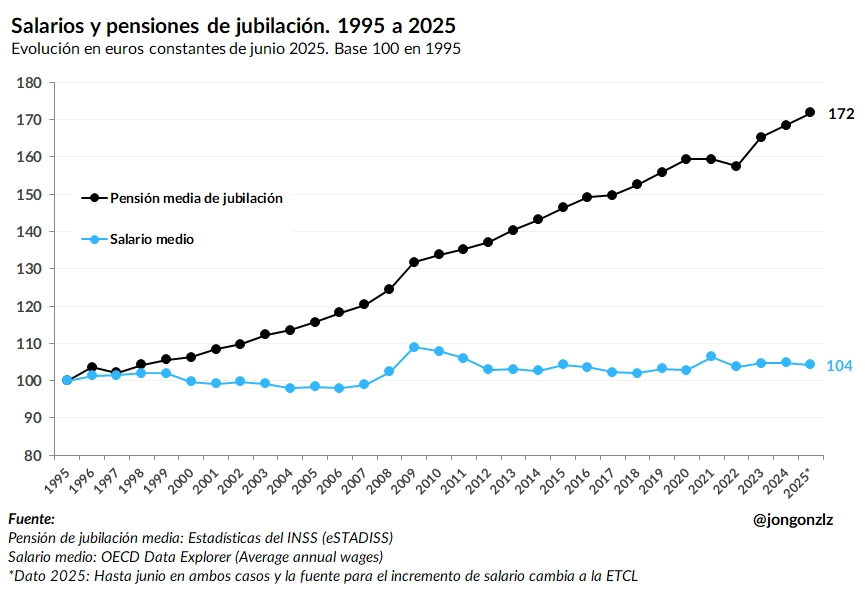
Another chart, this time with a longer horizon, 1995-2025, in constant euros. The conclusion about salaries is very similar to the first chart. It has a different data source, which is why the average salary isn't exactly the same, but you can see the same idea of stagnation.
Starting at 100 in 1995, by 2025 wages are at 104. Thirty years later, 4% higher in real terms. Pensions, on the other hand, have gone from 100 to 172. 72% higher than where they were.
This can be read in many ways. The most obvious reading is that your parents' or grandparents' pension has grown a lot more than the salary you're earning. The less obvious, and more uncomfortable, reading is that the Spanish pension system has kept a promise that the labor market hasn't. One generation has been protected. The one coming behind, not so much.
The real problem nobody wants to talk about
https://www.notion.so/Pensiones-vs-el-verdadero-problema-2ccf0c22a6908099acd0f17246b49a75
https://www.notion.so/Magnitudes-Vol-II-2cef0c22a69080e3a0bcc4207b43aa78
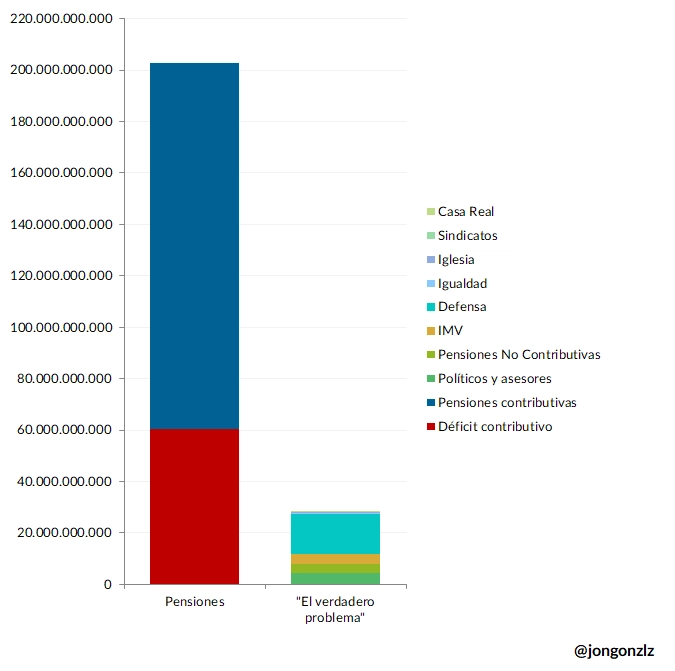
Here Jon shares two charts that are worth seeing together. The first puts contributory pensions and the system's deficit side by side with the sum of the "real problem" according to Twitter memes: politicians, advisors, official cars, unions, all those things everyone tells you that, if removed, would fix Spain. Well, here's what comes out: the "wasteful expenses" combined don't even come close to what it costs to sustain the pension system.
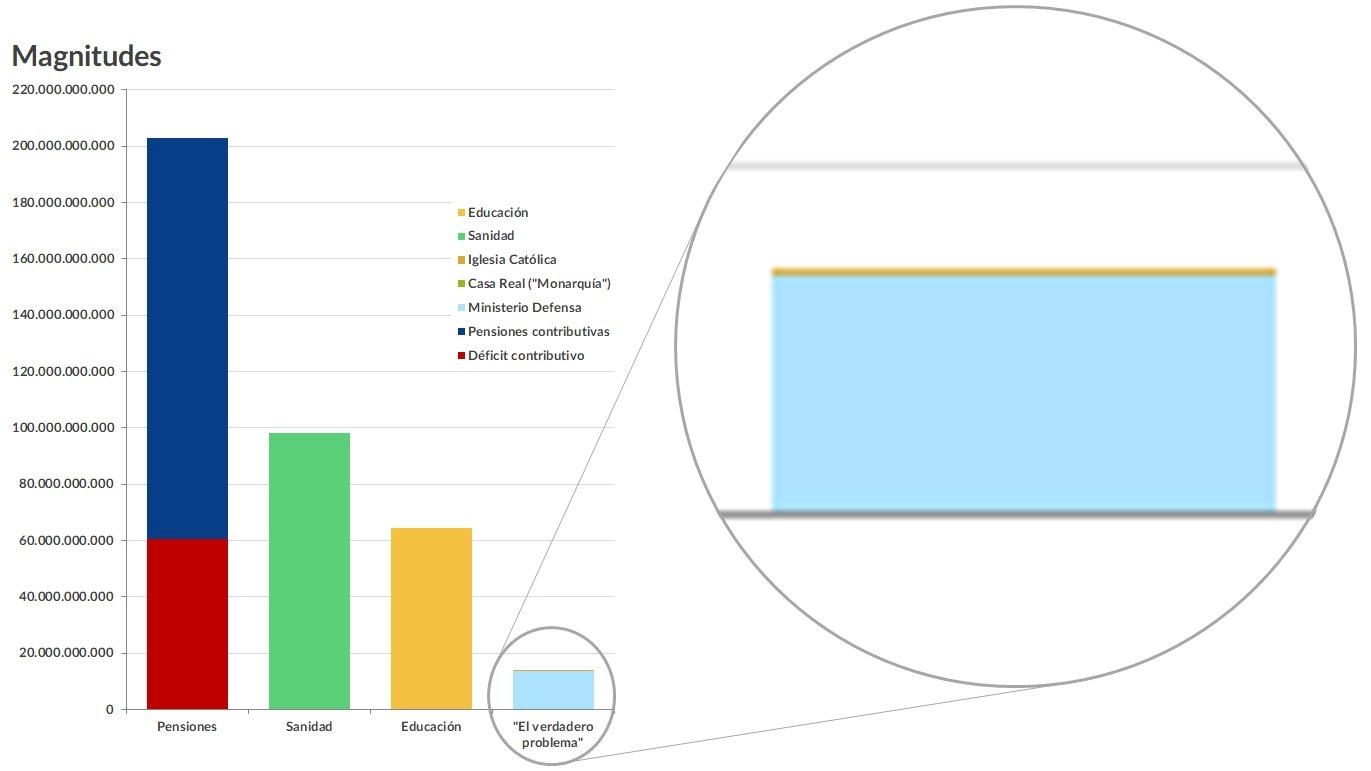
The second chart adds context by placing healthcare and education next to pensions, so you can see the real proportion. Pensions take up the biggest share of the Spanish public budget, by a wide margin. More than healthcare. More than education. And the trend is for this to keep growing, because the demographic pyramid is what it is.
Let me be clear: I'm not in favor of taking anyone's pension away. My parents are the first ones who have earned theirs, and I hope they enjoy it for many years. But the longer we take to talk about this without taboos, the bigger the snowball gets. And the generation paying the bill, mine and the one coming after, is already suffering the consequences of not having tackled this earlier: stagnant salaries, unaffordable housing, high tax burden.
That's why people leave (and why I left))
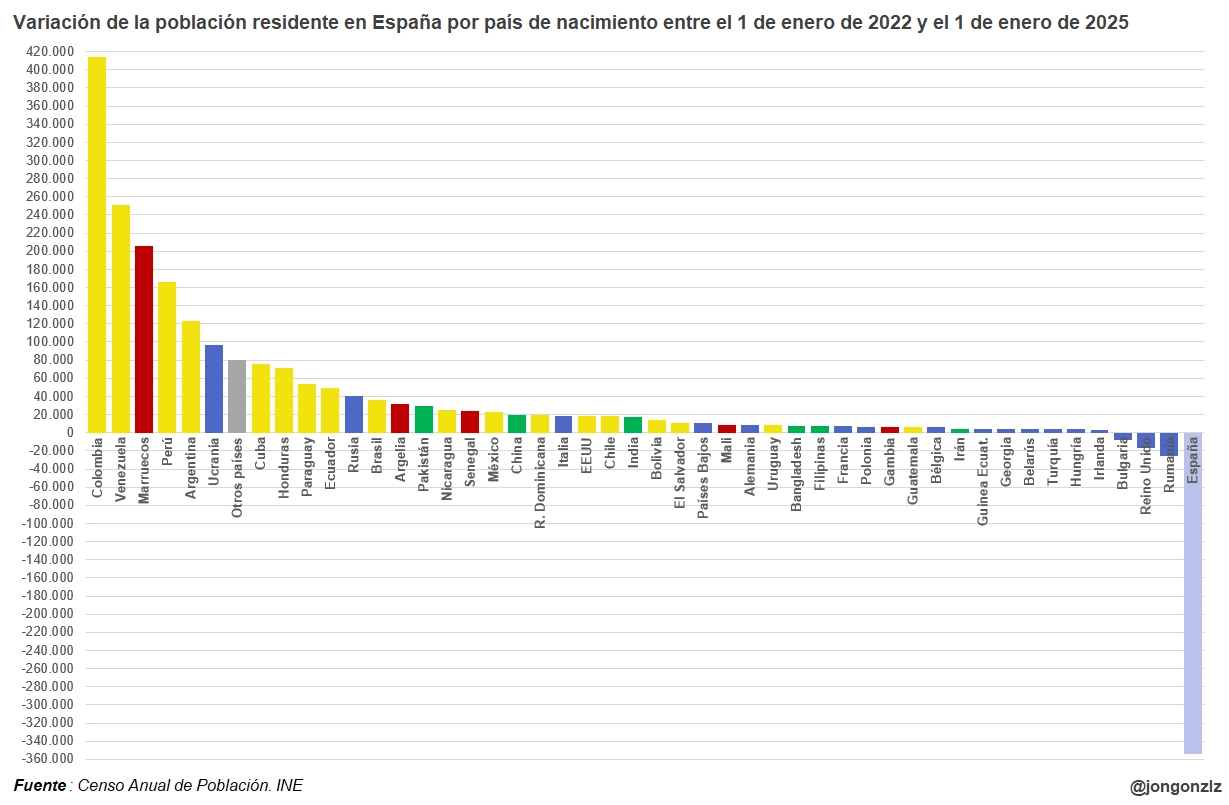
The last chart hit me especially hard. It's the variation in resident population in Spain between 2022 and 2025, grouped by country of birth. The three countries that have brought the most people are Colombia, Venezuela, and Morocco. And then, at the tail of the chart, several countries with a negative balance: Bulgaria, the United Kingdom, Romania. And, surprise or not, Spain.
Spaniards have fled en masse. That's what the data says. The trend is clear and goes in a definite direction.
When I saw this, I wasn't surprised. I left Spain a while back. I have close friends from school who also moved abroad, and don't even get me started on the number of Spaniards I met during the years I spent as a digital nomad around Europe and Asia. And this was happening even before the dates this chart shows.
Young people see that wages don't go up, that rent eats up their paycheck, and that buying a home is practically science fiction. Many chose to pack their bags. It's not a decision you make lightly, leaving family and friends behind is hard. But many of them want to try to build a better future.
What I think (and why you should draw your own conclusions)
Before I dump my conclusions on you, a note on how to read charts. There's a basic principle in statistics that everyone knows by the phrase "correlation is not causation". Just because two things go up at the same time doesn't mean one is the cause of the other.
The textbook example is ice cream and shark attacks. If you pull up ice cream sales statistics and put them next to shark attacks at beaches, you get a beautiful correlation: the more ice cream is sold, the more attacks there are. And yet, it's pretty clear that eating an ice pop doesn't turn anyone into a shark magnet. What's happening is that there's a third variable that doesn't appear in the chart and that drives the other two: summer. In summer it's hot, and people eat more ice cream. In summer there are more people swimming in the sea, and therefore more chances of crossing paths with a shark. Ice cream and shark attacks go up together because they're both symptoms of the same season, not because one causes the other. Statisticians call that third variable a confounding variable.
With the charts I've discussed in this article, something similar could be happening. I've drawn my own conclusions reading them and connecting them with each other, but I could be attributing causes that actually respond to a variable I'm not seeing. I could be completely wrong. I'm not trying to change your mind or get you to think like me. I'm just sharing my reading, which is mine and worth what it's worth. If you look at the same data and reach different conclusions, great. That's how discussion is supposed to work.
That said, my view of where the country is heading is pretty negative, and there are two opinions I do dare put in writing.
The first is about pensions. I don't think the State has any real incentive to fix the problem. Difficult decisions cost votes, and pensioners are a voting bloc that turns out in large numbers while the generation paying the deficit votes much less. This doesn't mean I'm in favor of taking away from anyone what they've contributed during their working life. But pensions, as they're sized today, are more of a problem than a solution for the generations coming after.
The second is about cuts. I'm in favor of eliminating every wasteful expense that can be eliminated: redundant political positions, duplicated advisors, empty institutions. Cutting them is the right thing to do, even if only for democratic hygiene. But as Jon's charts show, that's a very small part of the problem. The numbers don't add up just by cutting that. With the income the State currently has and the expenses it's committed to, you have to cut from many places. And one of the items that has to enter the conversation, like it or not, is pensions. Not "taking them away." Resizing them to what the system can sustain. Those are different things.
I don't have textbook solutions, and I'm pretty wary of anyone who offers them. The only thing that does seem clear to me is that when raw, real data is laid out plainly, that's when real conversation and exchange of ideas begin. That's why it matters to me that things like what Jon was doing don't disappear: because sometimes all you're missing to understand your own life is for someone to have taken the trouble to draw the chart.
While the Notion page is still public, take a look. And if you reach different and more positive conclusions than mine, even better.